
Monitoring infrastructure during construction is not a single task. It is a sequence of decisions, and each one depends on the quality of the last.
Most tools treat data collection, analysis, visualisation, alerting and reporting as separate steps. Sensly.io is designed differently. Sensly is built as a connected system that improves how monitoring work flows from data capture to reporting, reducing rework, preserving context, and helping engineers act with more confidence.
Understand sensor behaviour in relation to physical location, assets and site conditions. Sensly links data to place, improving interpretation and communication.
Sensor data presented in charts or tables provides limited context on its own. While trends and values may be clear, their relationship to physical location, site conditions or specific assets is often not immediately visible.
This lack of spatial context makes interpretation slower and increases the difficulty of communicating insights, particularly to non-technical stakeholders. Without a clear link between data and location, it becomes harder to explain what is happening on site and why it matters.
Sensly connects sensor data to its physical context by visualising locations and readings on maps and site imagery. This allows engineers and project teams to quickly understand how data relates to real-world conditions.
By combining live data with spatial views, Sensly supports faster interpretation and clearer communication. Both technical and non-technical stakeholders can see where sensors are, how they are behaving, and how this relates to construction activity or asset performance.
Sensly provides visual tools that place sensor data within the physical environment, improving both analysis and communication across project teams.
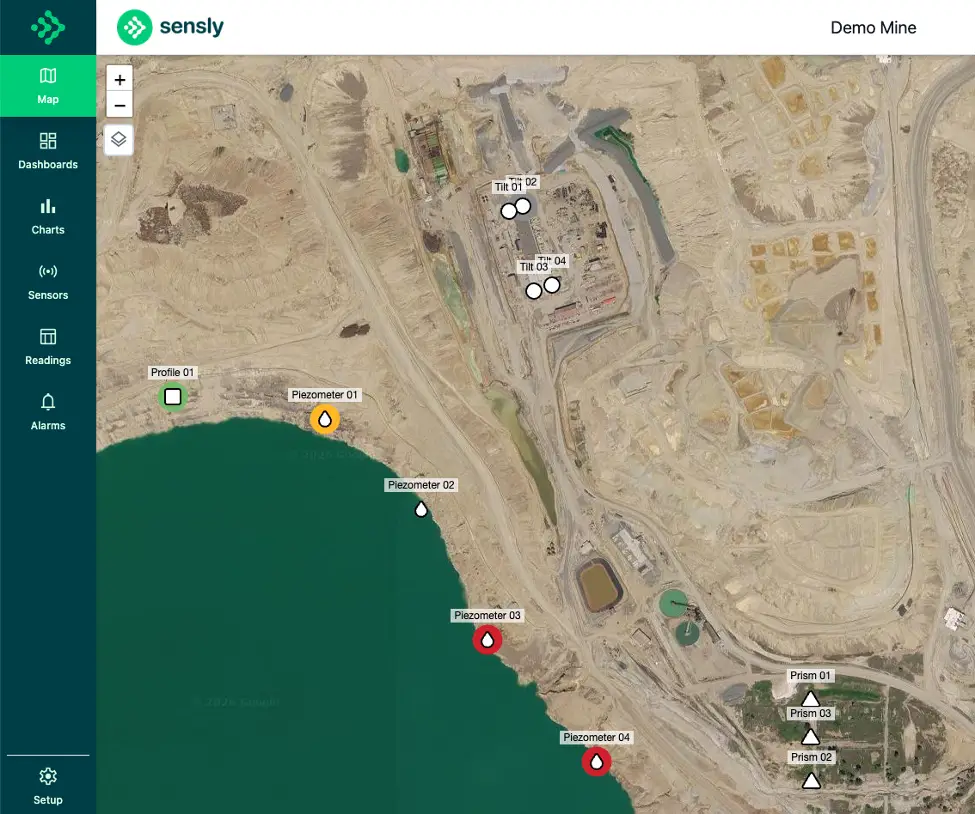

Sensly displays sensor networks within an interactive map interface, allowing users to explore data in relation to site geography. Sensors are positioned according to their real-world coordinates, providing immediate visibility of network layout and coverage.
Live sensor values can be viewed directly within the map, enabling users to assess conditions without switching between multiple views. This supports quicker identification of patterns, clusters or areas of concern across a site.
The interactive nature of the map allows users to zoom, filter and navigate large sensor networks efficiently, which is particularly important on complex infrastructure projects with distributed instrumentation.
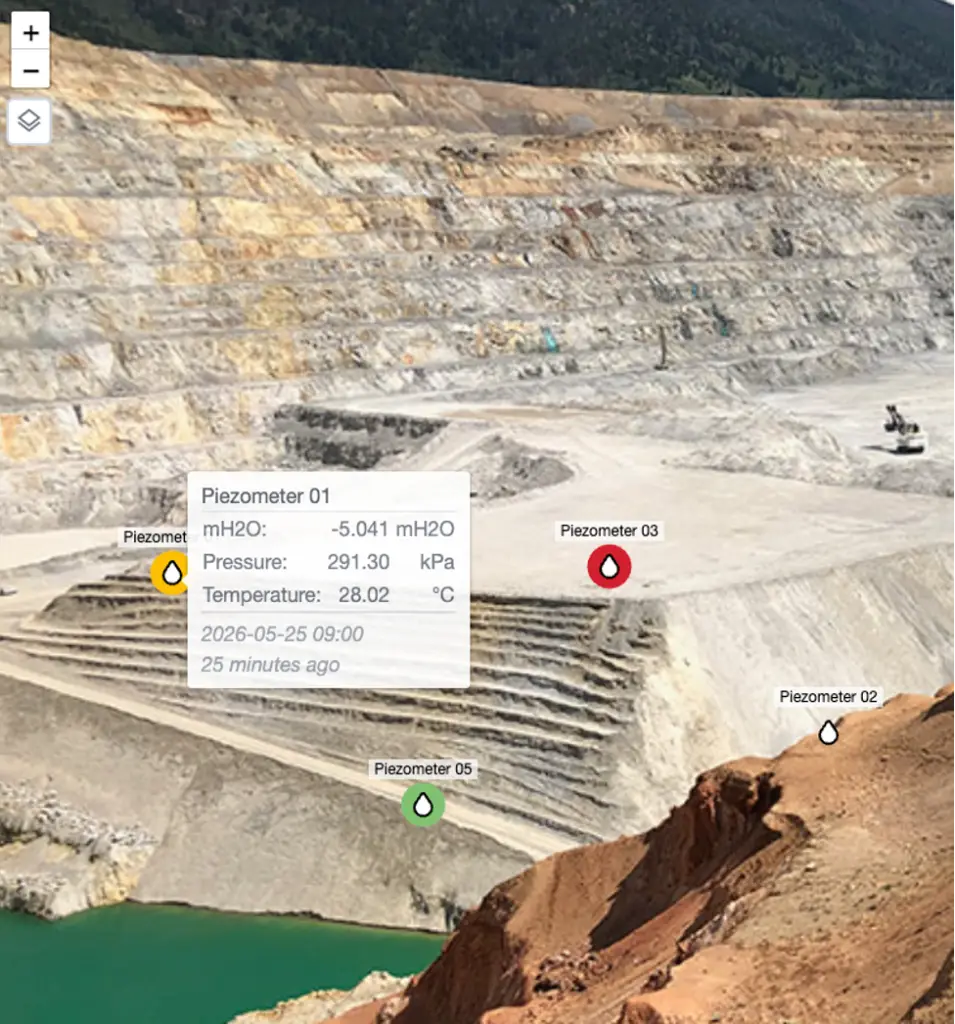

In addition to maps, Sensly supports the use of site images, drawings or plans as a background for sensor data. Sensors can be positioned on these images, providing a more intuitive view of how instrumentation relates to specific structures or construction elements.
Live readings are displayed alongside sensor locations, allowing users to interpret behaviour in the context of known site features. This is particularly useful where geographic maps alone do not provide sufficient detail, such as within tunnels, structures or staged construction environments.
Image-based views help bridge the gap between data and physical understanding, supporting clearer communication with project teams and stakeholders.

Sensor data and spatial representation are managed within a single platform, removing the need to cross-reference external drawings or systems. This improves efficiency and ensures that all users are working from a consistent, up-to-date view of site conditions.

Visual, location-based views make it easier to explain sensor behaviour to non-technical stakeholders, supporting clearer reporting and decision-making. This reduces reliance on abstract charts and helps align understanding across project teams.

By linking data to location, Sensly enables users to interpret readings in the context of surrounding conditions, rather than in isolation. This supports a more accurate understanding of how sensor behaviour relates to site activity, ground conditions or structural elements.
Sensly provides visual tools that place sensor data within the physical environment, improving both analysis and communication across project teams.